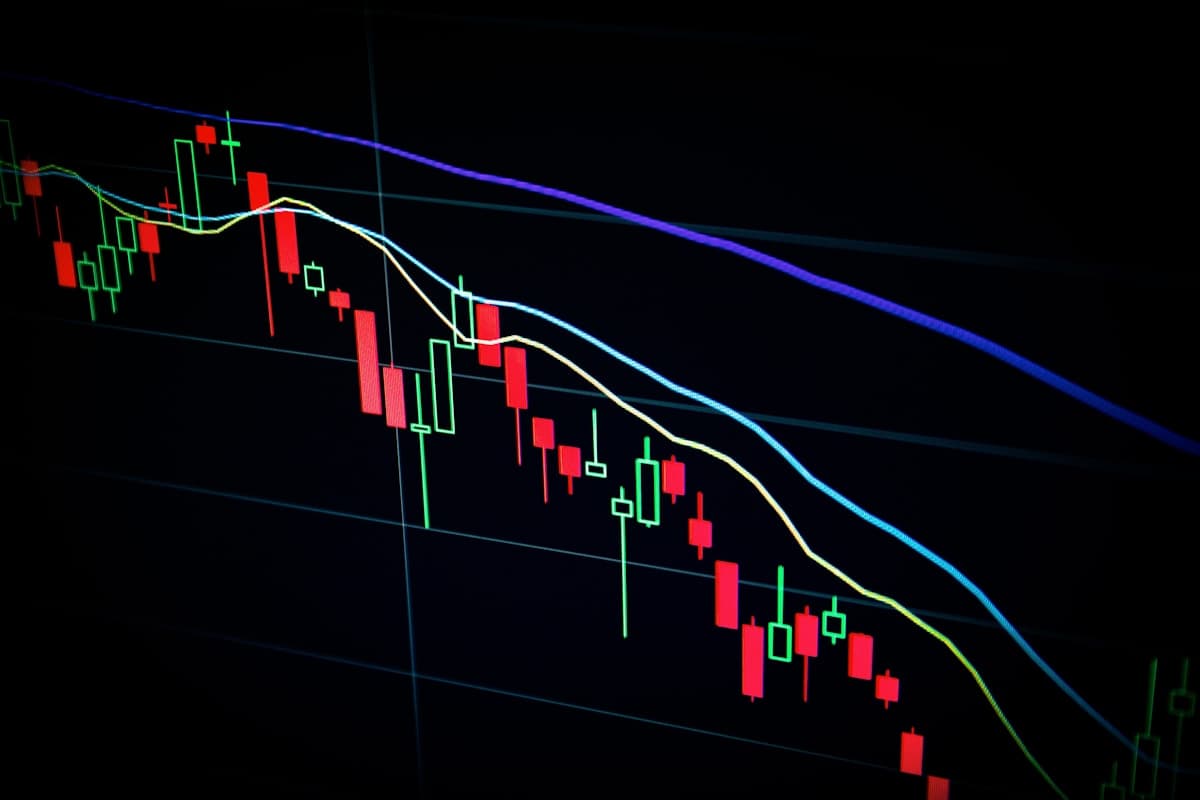
Bollinger Bands plot a middle moving average with upper and lower bands set at a chosen number of standard deviations. They visualize volatility as well as direction.
Default setup
A common configuration is a 20 period SMA with bands at two standard deviations. When volatility rises, the bands widen. When volatility falls, they contract.
Reading squeeze and expansion
A squeeze happens when bands narrow after a quiet period. Traders watch for a breakout once bands expand again. Direction should come from price action and trend context, not from the bands alone.
Walking the band: In strong uptrends, price can hug the upper band. That is not automatically overbought. In downtrends, price can ride the lower band.
Mean reversion angle
In range markets, touches of the outer bands sometimes lead to moves back toward the middle line. In trend markets, fading every upper band touch is expensive.
Practical settings
Shorter periods make the bands more sensitive. Longer periods smooth noise. There is no magic number. Test on the timeframe you trade and record results in a journal.
Risk note
Bands are descriptive statistics, not support and resistance by themselves. Always define invalidation if a band break turns into a real trend.