title: "Ichimoku Cloud Trading for Nordic Stocks" description: "How to use Ichimoku Kinko Hyo on Nordic equities. Cloud, Tenkan, Kijun, and practical setups that work on OMX names." category: Indicators author: "NordTraders Editorial" date: "2026-07-30" tags: [ichimoku, cloud, indicators, technical-analysis] word_count: 650
Ichimoku Kinko Hyo looks complicated. Five lines plotted at once. Most traders glance at it, get overwhelmed, and switch back to a 50 day moving average.
That is a mistake. Ichimoku was built for equity index trading by a newspaper journalist in Tokyo in the 1930s. It works best on liquid, trending names. Nordic large caps check both boxes.
The Five Lines
Ichimoku prints five lines on every chart. The two that matter most are the Conversion Line (Tenkan sen) and the Base Line (Kijun sen).
The Tenkan is a 9 period midpoint, plotted as the average of the highest high and lowest low over the last 9 bars. It moves fast. The Kijun is the same calculation over 26 periods. It moves slower.
When the Tenkan crosses above the Kijun, it is a bullish signal. Below, bearish. Think of it as a faster version of a moving average crossover, but anchored to actual price extremes instead of closes.
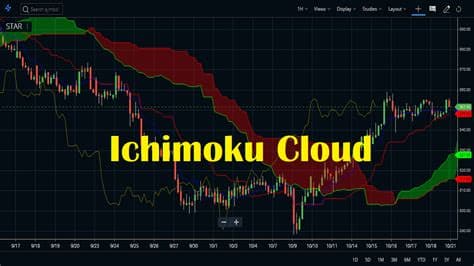
The Cloud itself is a shaded zone plotted 26 periods ahead. It is built from two lines: Senkou Span A, which is the midpoint of the Tenkan and Kijun shifted forward 26 periods, and Senkou Span B, which is the 52 period midpoint shifted forward 26 periods.
Price above the cloud is bullish. Below it, bearish. Inside the cloud, indecision.
The Chikou Span is the current closing price shifted back 26 periods. If it sits above the price from 26 bars ago, bulls are in control.
What to Ignore
Most Ichimoku guides treat every line as equally important. They are not. The Tenkan-Kijun crossover and the cloud are the core. The Chikou Span is useful as a confirmation but plenty of good trades happen with the Chikou still below price.
Also ignore the cloud color. Green cloud, red cloud — it moves slowly and flips late. The position of price relative to the cloud tells you more than the cloud color ever will.
Setups That Work on Nordic Names
A clean setup on a Nordic large cap looks like this. Price is above the cloud. The Tenkan crosses above the Kijun while both are above the cloud. The Chikou Span sits above price from 26 bars ago. You enter on the next bar, put your stop below the Kijun or below the nearest swing low, whichever is tighter.
This shows up a few times a year per name. OMXS30 and OMXH25 names produce it more cleanly than OMXC25 names because Swedish and Finnish large caps trend better.
A second setup worth knowing. Price is in a clear uptrend, then pulls back into the cloud but does not close below it. The Tenkan crosses the Kijun again on the way out. That is a continuation signal and often gives a better risk entry than waiting for a new breakout.
Where It Fails
Ichimoku gets chewed up in sideways markets. When price chops inside the cloud for weeks, the Tenkan-Kijun crossovers fire repeatedly and nearly all of them fail. That is normal. The indicator was built for trending equity indexes, not rangebound small caps.
It also needs liquid names. On a stock that trades 50,000 euros a day, the signals are noise. Stick to names where the daily candle is built from real volume.
If the scanner flags a setup and the Ichimoku chart agrees with a bullish cloud and a fresh Tenkan crossover, that is a stronger signal than either alone.