MACD Indicator: How to Use It
The Moving Average Convergence Divergence indicator is one of the most widely used tools in technical analysis. It combines trend following and momentum into one visual. Understanding what it actually measures prevents misuse.
How MACD works
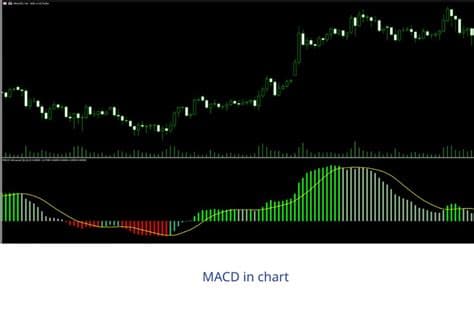
Three components make up the standard MACD:
The MACD line is the 12 period exponential moving average minus the 26 period EMA. When the faster average crosses above the slower one, the MACD line rises. When it crosses below, it falls.
The signal line is a 9 period EMA of the MACD line. Slower and smoother than the MACD line itself.
The histogram is the difference between the MACD line and the signal line. It shows momentum accelerating or decelerating.
Three classic signals
Signal line crossover. When the MACD line crosses above the signal line, it is a bullish signal. Below is bearish. These are lagging indicators. The crossover happens after the move has started. That is the tradeoff of trend following tools.
Zero line crossover. When the MACD line crosses above zero, the short term average has moved above the long term average. The trend is shifting from bearish to bullish. This is slower than the signal crossover but produces fewer false signals.
Divergence. When price makes a higher high but MACD makes a lower high, momentum is weakening. Bearish divergence warns of a potential reversal. When price makes a lower low but MACD makes a higher low, momentum is improving. Bullish divergence warns of a potential bottom.
Divergence is the most useful MACD signal but the hardest to read in real time. It often appears days or weeks before the actual reversal.
Settings
The standard 12, 26, 9 works for most markets and timeframes. Shorter settings like 5, 13, 8 give faster signals with more noise. Longer settings like 20, 50, 12 give slower signals with fewer false positives.
Test different settings on your instrument and timeframe. There is no universal best setting. What works on daily OMXS30 charts might not work on hourly US stock charts.
Nordic stocks and MACD
Nordic large caps trend well, which suits MACD. The signal line crossover on the daily chart of Atlas Copco or Volvo catches most of the trend. Divergence signals on Novo Nordisk weekly charts preceded several major turning points.
Avoid MACD on small Nordic caps. The indicator needs sustained trends to work. Thinly traded small caps chop too much. MACD will give signals that reverse before you can act on them.
Combining MACD with other tools
MACD crossovers work better when the price structure agrees. A bullish crossover at support is stronger than one in the middle of a range. A bearish divergence at resistance is stronger than one in no man's land.
Pair MACD with volume. A bullish crossover on rising volume confirms participation. On falling volume it is suspect.
Do not use MACD and RSI together for the same signal. They measure similar things and will agree most of the time. That is not confirmation. It is redundancy.
When MACD fails
MACD fails in choppy sideways markets. Crossovers happen frequently with no follow through. Each false signal costs you money. If your market has been rangebound for weeks, turn off MACD and switch to support and resistance.